Stock Market Volatility: An Inescapable Reality for Investors
We know it is going to happen, but we always worry when it does. In this week’s Fastest 4 Minutes in Finance, a reminder that if you are going to invest in stocks, you have to be prepared for a bumpy ride.
One of the people we pay attention to in the world of economists and market strategists is Ryan Detrick. He’s formerly with LPL Financial, and now the Chief Market Strategist for Carson Group. The headline of one of his recent blogs caught my attention. It read, “Stocks Can Go Down.”
April 2024: A Turbulent Month for Stock Market Pullbacks
April has been bumpy. In fact, it could be the first month to be negative since October. At the time of this recording, the S&P 500 Index is down nearly 4% in April.
The Index had been on a tear up until this month. According to Detrick, at the beginning of the week the market was up 30% over the past 12 months, and was up 27% in the first 100 trading days after the October lows. According to Yahoo Finance, the first quarter of 2024 was the best first-quarter return in five years.
Historical Data: Preparing for Frequent Stock Market Corrections
But just a sure as the sky is blue, what goes up must come down. In fact, the smooth ride up in the first quarter was unusual. The roller coaster ride is what we should always expect.
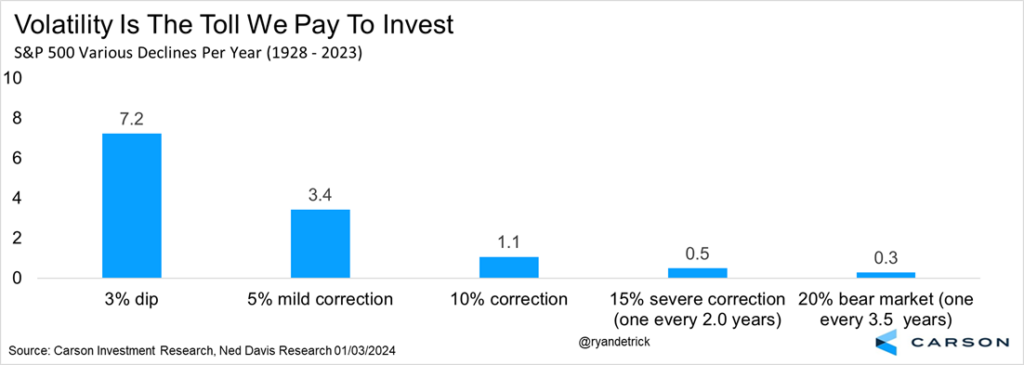
Take a look at this chart from Carson Group. This shows that since 1928, every year, on average, sees a significant pullback.

You can see on the far left of the chart, that an average year has, not one, not two, not three, but a little over 7 drops of 3%. April is the first one of those in 2024. The average year produces more than 3, 5% corrections, and it’s even commonplace to have 1, 10% correction every year. On average, the S&P has pulled back 15% about once every 2 years, and 20% once every 3 and a half years.
To reinforce the narrative that NOT having a pullback is the exception, not the rule, only 3 times since 1980 has the S&P 500 not had at last a 5% pullback.
Factors Driving Current Market Volatility: Geopolitical Tensions to Fed Rate Hikes
There are plenty of reasons we should expect more volatility. There is the potential of an escalation in the Middle East conflict, continuing worries over interest rates remaining higher because inflation is still above the Federal Reserve target. It’s a Presidential election year.
Short-Term Pullbacks, Rapid Market Recoveries: Lessons from History
But, here’s why I think pullbacks are really common. There are always reasons to worry. Said another way, there’s always a reason not to invest in the stock market. But, those reasons, don’t historically derail the market for long.
According to LPL Research, even some of the worst geo-political events in history proved to be a hiccup in the stock market’s trajectory. After the 9/11 terror attacks, the S&P’s total pullback was 11.6%. It took only 31 days to recover all of it. Two years ago, after the escalation of the Russia/Ukraine conflict, stocks fell 6.8% but were all the way back in 23 days. Last October, the Israel-Hamas war prompted a drop of 4.5%, but stocks bounced back 19 days later.
Embracing Volatility: The Price for Long-Term Investment Success
Bottom line — short-term volatility is the price we pay to meet our long-term financial goals. Or, as Ryan said, stocks can go down.
The opinions voiced in this video and blog are for general information only and are not intended to provide specific advice or recommendations for any individual.
To determine which strategies or investments may be suitable for you, consult the appropriate qualified professional prior to making a decision.
References to markets, asset classes, and sectors are generally regarding the corresponding market index. Indexes are unmanaged statistical composites and cannot be invested into directly. Index performance is not indicative of the performance of any investment and do not reflect fees, expenses, or sales charges. All performance referenced is historical and is no guarantee of future results.
The Standard & Poor’s 500 Index (S&P500) is a capitalization-weighted index of 500 stocks designed to measure performance of the broad domestic economy through changes in the aggregate market value of 500 stocks representing all major industries.
Securities offered through LPL Financial, Member FINRA/SIPC. Investment advice offered through Independent Advisor Alliance. Independent Advisor Alliance and GenWealth Financial Advisors are separate entities from LPL Financial.


