August Market Turmoil
A lot has happened in the stock market since we recorded last week on July 31st. The first three trading days of August were awful. Triggered by some disappointing economic data, the S&P 500 Index dropped like a rock. As we reviewed the data, we were a bit perplexed. Yes, employment data missed on expectations, and yes, the ISM manufacturing data showed that an economic slowdown is happening. But, that’s been pretty clear for months.
Not to mention, for the most part, investors have been excited to see disappointing data. The general sentiment has been that if the economy slows, the Federal Reserve will cut interest rates, which will help stimulate the economy and we miss a recession. That’s the so-called soft-landing scenario.
But, this time, the bad news was seen as bad news. Then, Monday, Japan raised interest rates. That was a surprise move and shook global markets, including the U.S. According to our partners at LPL Research, this was due in large part to what’s called the carry trade. This is when investors borrow in a currency with low interest rates an invest in a currency with relatively higher interest rates. It’s like a margin call forcing borrowed currency to be repaid.
At its low point, the S&P 500 was off about 6.8% in those three days. The NASDAQ dropped 9.5% over the same period.
Market Rebound and Panic Selling
There was likely some panic selling involved here. Investors were jumping off what they perceived as a sinking ship.
But, then came Tuesday, and so far, Wednesday, the day we are recording this video. In those two trading days, the S&P 500 has climbed back up almost 3%, and the NASDAQ has re-claimed about 4%.
The Pitfalls of Market Timing
So, what’s the lesson here? It would be expected that watching the market drop would make you, as an investor, to want to get out of the market until things got more stable. But, what if you did? Did you think things were stable by Tuesday and Wednesday? Not likely. So, if you got out as the market was falling, and didn’t get back in in time to get the bounce back, where would that leave you over a long period of time?
The data suggests that the average investor underperforms the stock market by a significant percentage, mainly because they try to time the market. It’s impossible to perfectly time the market, because, as this week has proven, you have to be right twice.
Market Corrections: A Historical Perspective
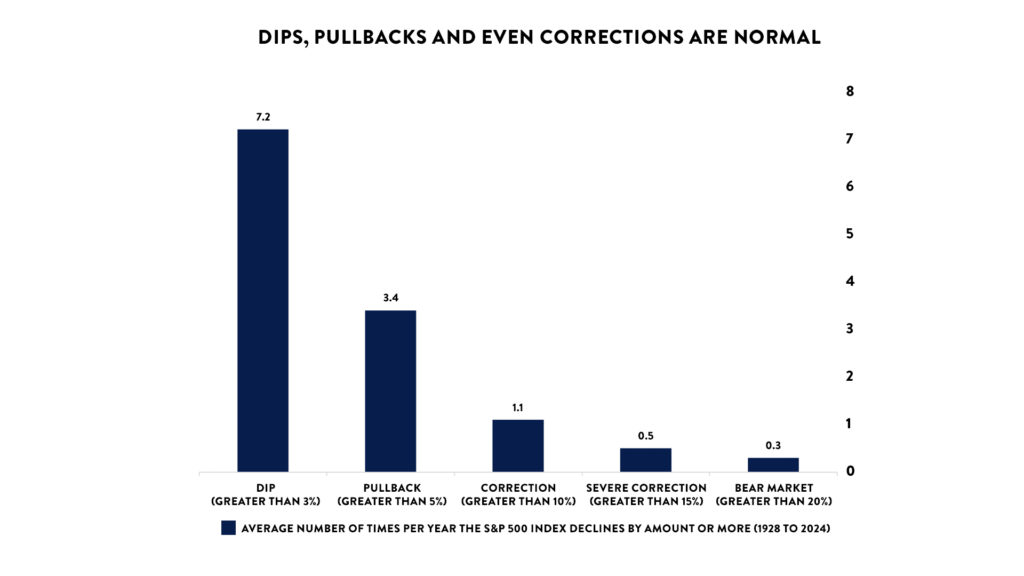
Remember, pullbacks and corrections are normal, even in good times. Check out this chart from LPL Research.

From 1928, through this year, the S&P 500 Index has averaged 7.2 3% or more dips per year, 3.4 pullbacks of more than 5%, and at least 1 10% correction per year.
Market Rebound and Panic Selling
There was likely some panic selling involved here. Investors were jumping off what they perceived as a sinking ship.
But, then came Tuesday, and so far, Wednesday, the day we are recording this video. In those two trading days, the S&P 500 has climbed back up almost 3%, and the NASDAQ has re-claimed about 4%.
Long-Term Investment Strategy
Knowing when they will happen is less important than knowing that they will happen. Staying invested through the volatility is the best way to stay on track for your goals.
The opinions voiced in this video and blog are for general information only and are not intended to provide specific advice or recommendations for any individual.
Securities offered through LPL Financial, Member FINRA/SIPC. Investment advice offered through Independent Advisor Alliance. Independent Advisor Alliance and GenWealth Financial Advisors are separate entities from LPL Financial.


