Market Overview: S&P 500, Dow, NASDAQ, and Bond Yields in 2024
At the time of this recording, the S&P 500 Index is up 14.8% Year-to-date. The Dow is up 6.1%. The NASDAQ up 17.5%. The Russell 2000 has climbed 9.9%, and the yield on the U.S. 10 year bond is up more than 9%.
It’s been a great year so for most options that investors have. Today, we have a couple of charts from the LPL Research team that will give us a more in-depth look at where investor cash is flowing. The charts measure, in billions, the net inflows or outflows of a particular asset class or sector through the first 6 months of 2024.
June 2024 Inflows: Foreign Equities and Fixed Income Lead
Before we get to that, here are some numbers from just the month of June. The largest inflows were into foreign large-blend equities. $8 billion was the net number here. LPL tells us this is the continuation of a trend. You’ll see that in the upcoming chart.
Three of the next 4 top categories were fixed income. Long government gained $5.5 billion, corporate bonds inflowed $4.6 billion, and ultrashort bonds increased by $4.5 billion.
Year-to-Date Asset Class Flows: Bonds Back in Favor
Again, that’s just in June. Let’s take a look at the inflows and outflows Year-to-date.

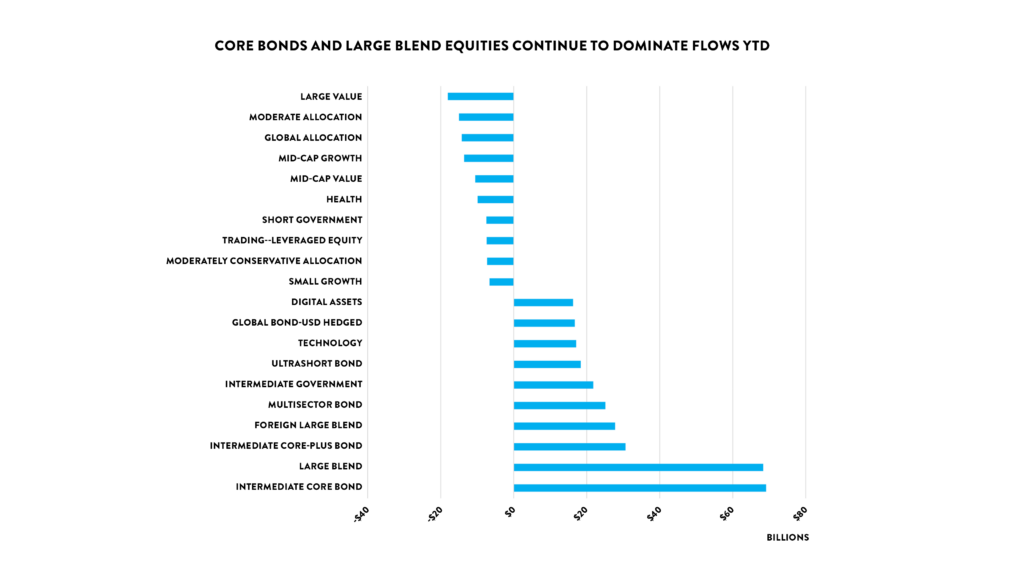
The first chart measures asset classes. At the top of the chart are the biggest outflows. Large value funds have seen the biggest decrease. $18.1 billion has left this asset class in the past 6 months. As LPL points out, this is not a surprise, given the outperformance of growth stocks this year.
At the bottom of the chart, you can see the biggest winners. You can that intermediate core bonds and large blend funds are at the top. Intermediate core bonds increased by $69.1 billion this year so far, and if add the third highest inflow on the chart, intermediate core plus bonds at $30.1 billion, you can see bonds are clearly back in favor. This makes sense as well, since the expectation is that the Federal Reserve will cut interest rates soon, which would be good for the total return of bonds. Remember, if interest rates go down, bond prices go up.
Equity Sector Flows: Technology Dominance and Healthcare Decline
Our final chart shows inflows and outflows by equity sector.

Again, no surprise winner here. Technology is leaving every other sector in the dust. $17.1 billion flowed into tech, and it hasn’t slowed down much. It was far and away the top sector in just June as well. This coincides with performance as well. Technology stocks have outperformed other sectors over the past two years. But, the emphasis on tech has detracted from almost every other sector. You can see, the industrials sector, and the financials sector are the only two sectors outside technology to have positive inflows. Healthcare is at the bottom. $9.9 billion has flowed out of this sector. LPL says investors have continued to rotate out of healthcare because of slowing COVID-19 related sales, patent expirations, and election uncertainty.
Disclaimer and Closing
These charts should not be used to make your investment decisions, and we are not making recommendations. This is strictly for informational purposes. You should work with a financial advisor to build an investment strategy that fits your overall financial plan.
The opinions voiced in this video and blog are for general information only and are not intended to provide specific advice or recommendations for any individual.
Securities offered through LPL Financial, Member FINRA/SIPC. Investment advice offered through Independent Advisor Alliance. Independent Advisor Alliance and GenWealth Financial Advisors are separate entities from LPL Financial.


